
How anomalies drove my social science research

This post is an account on how I came to hold some of my views about how the economy and politics work. I’ve always been interested in social sciences and also natural science. I chose to study natural a science, earning a BS in chemistry, Subsequently I pursued chemical engineering in grad school because of the better job prospects it offered. After getting my Ph.D. I was an applied scientist in the pharmaceutical industry for more than 32 years.
I began to invest in stocks in the mid-1990’s and did some research on stock market returns over time to aid investment decisions. I came up with a concept I call business resources or R which was defined as the cumulative retained earnings on a stock index over time, put into constant dollar terms using the CPI. I then divided the index value (adjusted for inflation) by R to obtain the ratio P/R which can serves as a valuation tool. Based on P/R I noted there had been cycles and we were in the rising portion in one of these in the 1990’s. Based on this analysis I forecasted that this rising trend should come to an end at a Dow Jones Index value of between 10000 and 15000 sometime between 1999 and 2001. I put our money in an index fund.
I first wrote about this in a web page in 1997, at which point I had refined my forecast to 9,000-12,500 on the Dow. I did some more research on financial and economic cycles that might shed light into why stock prices should show the pattern I had identified. I was active on the internet by this time and eventually found a discussion site about the “long wave” a general term for cycles in financial markets and the economy like the one I had found. I soon learned my cycle was closely related to the Kondratiev cycle (K-cycle), a 50-60 year cycle first defined in terms of commodity prices, but which also seemed to be correlated with interest rates, wars and economic innovation. I published a book on my cycle and its relationship with the K-cycle and to economic innovation using Harry Dent’s concept of the innovation wave or leading sector as I refer to it in my substack. My book forecast the start of a long period of poor stock market performance beginning in 2000 and did quite well for a self-published book by a nobody. This was because the timing was very good, I sent it to the publisher in March 2000, when the market put in its daily peak and it came out only a couple of months after the market peak on a monthly-average basis. A friend who had reviewed by manuscript got entirely out of the market after reading it and was very happy with his decision.
From Harry Dent’s work I learned about the Strauss and Howe generational cycle that got some attention some years back when it was learned that Steve Bannon was a big fan. I too was a fan and wrote a second book about the K-cycle in which I developed a hypothesis that it and related cycles were a consequence of a generational mechanism along the lines of the Strauss and Howe concept. This work led me to a believe that the “natural” length of my stock cycle roughly corresponded to two generations or about 36 years. The first (up) half of the current cycle had run from 1982 to 2000, and I expected the second down trend to run around the same amount of time. I began to writes a serious of online articles about the progress of the ongoing stock market downtrend (secular bear market). I would feature a plot of the current market position (expressed in terms of P/R) compared to previous cycle downtrends. Figure 1 shows a current view of this plot. For 14 years, market behavior corresponded to the behavior seen in previous cycle down halves (called secular bear markets). During this time I expanded my cycle analysis into politics and efforts at finding methods of empirically validating the existence of the Strauss and Howe generational cycle, which was a core piece of the models with which I was working. These efforts included empirical tests in which I made explicit predictions of future events which could either come true or not in an unambiguous way. Such predictions served a role like going into the laboratory and doing experiments, which was the sort of hypothesis-testing I did in my professional work.

Figure 1. P/R trends for post-1999 era compared to prior secular bear markets
After completing a set of forecasts in the first half of the 2000’s the time came to wait to see if they came true. Some did. I predicted a K-cycle event I called the fall from plateau should happen within a decade after the 2000 stock cycle peak, which it did. A political prediction that 2008 should be a critical election did not come true. Other predictions such as rising sociopolitical instability (as measured by mass shootings) came true while rising strike frequency did not. My predictions were batting 0.500, which implied that the extensions to politics and sociology did not work, leaving only the original stock cycle and its correlation with the K-cycle as the only valid portions of my cycle models. Then in 2014, year 15 in Figure 1, P/R rose above the range established by previous secular bear markets. In 2015 I made a final prediction which if it did not come true would completely invalidate the entire corpus of generational-based cycles about which my books were based. It did not come true, and I now consider the hypothesis of generational cycles based on the Strauss and Howe concept as invalidated.
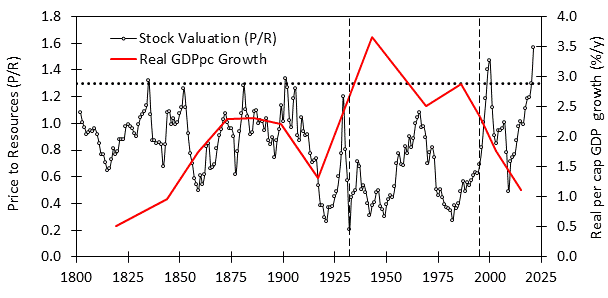
Figure 2. Trends in P/R and economic growth over 220 years
To give an idea of what had happened, Figure 2 shows a 220-year plot of P/R showing successive stock cycles. Note how P/R did not rise significantly above a value of about 1.3 for nearly two hundred years before rising to 1.47 in 2000. This peak, though much higher than any previous one, was not statistically significantly higher (though it was close). The recent peak in Jan 2022 is clearly higher. Something happened to change this long-term pattern of stock market behavior. Also shown as the red line is a plot of trend growth in per capita GDP. Growth over selected periods was measured from business cycle peak to peak in an effort to a capture the trend (prior to 1854 stock index peaks were used to select for cycle peaks). The result shows a rise in trend growth rate over the 19th century reflecting industrialization. Then there is a slowdown in economic growth after 1900, followed by a period of very strong trend growth roughly spanning the 1930’s to 1990’s, with a second drop in trend growth after 2000. The period of strong growth roughly corresponds to a period of unusually low values of P/R, the average value of P/R over 1933 to 1995 was 0.57, compared to 0.87 for the period before 1933. The period since 1995 has seen very high levels of P/R, 1.03 on average. These super-high valuations were the cause of the failure of my stock cycle model. It is almost as if energy that used to be directed to economic growth was now being directed towards higher stock market valuations.
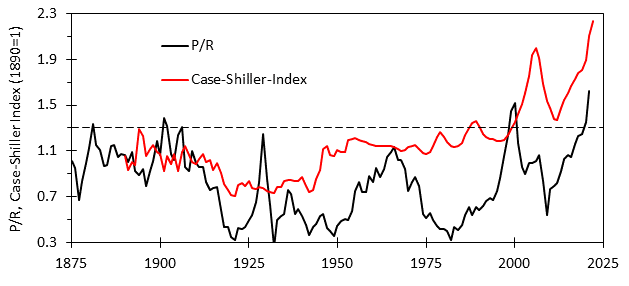
Figure 3. Long terms trends in P/R and housing valuation
It’s not just stock market values. Figure 3 shows a plot of the inflation-adjusted Case-Shiller Real Estate index along with P/R. It shows that rising stock market valuations appearing around the end of the 20th century corresponded to rising valuations in another asset class, housing. After a century in which home prices saw the same sort of limit on price rise as stocks did for two centuries, real estate prices began to move higher just like stock prices, except in a much more dramatic fashion. Any young couple trying to buy their first home can attest to the unaffordability of housing today. Something weird (and very real) has been going on for decades by now. It seems to me some answers are needed.
There is another anomaly that I first noticed in 2010. My P/R stock market valuation measure that I introduced in Stock Cycles is based on something I call Business Resources, one definition of which is “that which businesspersons use, along with labor, to produce sales and profits.” This struck me as the same sort of thing as capital, meaning R could be thought as the capital represented by the index, making the index value (P) the market value for that capital. Since the stock market is a capital market, P/R represented the current market assessment of the value of capital. Since labor and capital are both factors of production it seemed reasonable that economic output should track growth in number of workers and growth in capital. I found that a plot of per capita GDP versus R showed a reasonably linear relation and presented this in Stock Cycles. This suggests that per capita GDP might be used as a proxy for R, and the ratio P/GDPpc might also serve as a valuation measure. Indeed, an expanded version of this idea in which P is replaced by market capitalization and GDPpc is replaced by GDP yields a valuation measure known as the Buffet ratio. It is always reassuring when someone much smarter and more knowledgeable than you is thinking along the same lines as you are.

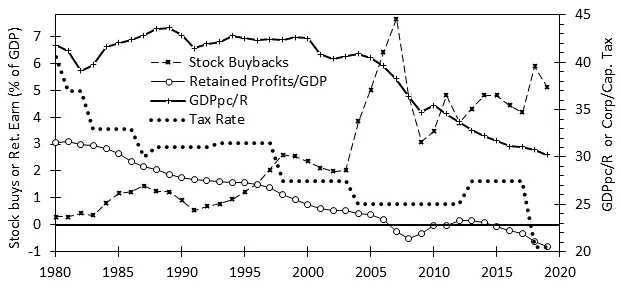
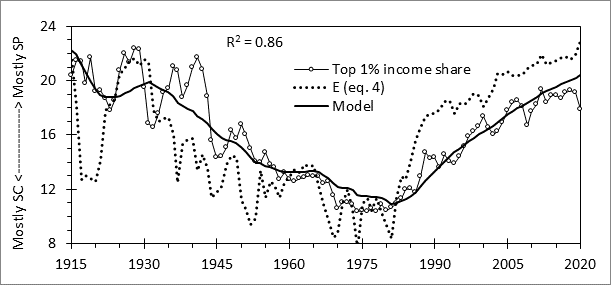
Figure 4. Capital productivity (GDPpc/R) over time.
Based on the idea that GDPpc can be used as a proxy for R, one might expect that the ratio of GDPpc to R to be roughly constant. Figure 4 shows a plot of this ratio. It was indeed constant, but not all the time. It ran at around 43± 2 about two-thirds of the time since 1870. Between 1907 and 1943 and since 2006 it fell to much lower levels. Output per unit capital is a measure of capital productivity. That capital productivity should be a roughly constant (maximal) value makes sense because anything lower is wasting capital, which is not something that capitalist businesspersons would ever choose to do. The fact that it obviously happened after the Panic of 1907, and persisted for decades before being corrected, and has recently happened again, would be a cause for concern for capitalists, I should think. Hence, I called the onset of periods of depressed capital productivity capital crises. That capital was becoming less potent in producing economic output is a very likely candidate for the decline in trend economic growth rates illustrated in Figure 4. What on earth happened in 1907 and 2006? The answers were slow in coming.
The failure of my old generational framework in 2014 led me to look at alternative frameworks. One was Peter Turchin’s cycle ideas. A reader of my books e-mailed me about Dr. Turchin’s work, suggesting I might be interested. I briefly checked out his ideas and found his secular cycle seemed to correspond to longer-term cycles such as those discussed Fisher’s Great Wave. I was familiar with this cycle and considered it as trend to be removed to fully visualize the K-cycle as I had done with my reduced price analytical tool.
After 2014 I turned to Turchin’s model to see what it could offer. It offered plenty such as cycles characterized by empirical data (something I had tried, and failed, to establish for generational cycles). Furthermore, there were math models consisting of systems of first order differential equations analogous to the tools I used to characterize biochemical systems in my professional work. I found Turchin’s work intriguing, e-mailed him and he suggested I submit a manuscript to the new Cliodynamics Journal he had founded. I did that and my first paper came out in 2016, where I used the models I had learned to fit data I collected to see how well it explained the observations. As my primary interest was in modern-day America and not in pre-industrial England, I eagerly awaited publication of Turchins’s Ages of Discord. This provided the needed framework on which to build a new model of dynamics in the American political economy to replace what had been invalidated in 2014.
Turchin’s analysis of the American secular cycle relied on the same sort of demographic driver as his agrarian model. This did not make economic sense. The agrarian model worked because (agrarian) economic output (and hence demand for labor) was physically limited by the amount of land. Hence rising population (of workers) competing for a limited number of jobs drove the inequality cycle responsible for elite proliferation, rising conflict and state collapse, as expressed in his math models. But the industrial economy has no such limits, workers are also consumers; the economy (and demand for workers) grows with population. There is no inherent limit to growth and Turchin’s analysis was flawed. I noted this in a 2017 paper in which I introduced the capitalist crisis. I found the 1907 capitalist crisis was a good explanation for the shift in P/R valuation to lower levels that is evident in in Figure 2. In the 2017 paper I suggested the cause of the 1907 capitalist crisis was rising inequality; rich people spend less of their income on consumption so a shift to high inequality would mean a reduction in aggregate demand and lower economic growth, regardless of the amount of capital thrown at it. This sort of explanation would not work for the 2006 capitalist crisis, which happened at a lower level of inequality than the previous one, and for which economic models suggested little impact of inequality on aggregate demand. As I later found out and reported in my book America in Crisis, the cause of the recent capitalist crisis is the rise in stock buybacks since the mid-1990’s. These have fueled the rising stock market valuations in recent decades. Hence, the shifts in stock market valuation and in economic growth depicted in Figure 2 reflect the post-1907 and 2006 capitalist crises depicted in Figure 4. The cause of the first crisis was inequality, while that of the second is related to inequality as well. The theory that brings both together is the cultural evolution model I presented in a 2019 paper and in this Substack post.
This model proposes that business culture is a mix of shareholder primacy and stakeholder-centered variants and uses inequality as a proxy for the relative amounts of each. Shareholder primacy culture prioritizes shareholder value above all else: the objective of business is to grow stock prices. For stakeholder culture the objective of business is to grow the economy, that is, sales, profits, new product development, and market penetration. Shareholders are still important of course, but so are other stakeholders. It is easy to see how businesspersons enculturated under shareholder primacy would employ stock buybacks rather than investing for growth as has increasingly become the case as shareholder culture has become dominant. And it is easy to see how growth would be strong and stock market valuations lower when businesspersons were encultured under stakeholder culture.
The cause of the shift from one culture type to another is government economic policy, which is set by politics. So, one now has to look into political cultural evolution and how political actors both deliberately and unintentionally enacted the policy that make this happen. All this material is laid out in a more coherent fashion in America in Crisis (240 pages, 85 figures & tables, and 400 references).