
How my analytical approach is different Part I

Many scholars use what I would call the inspection method to analyze some social phenomenon. This entails reading a lot about the phenomenon from a variety of viewpoints and then constructing a synthesis of these ideas, plus the scholar’s ideas, into some coherent form which is expressed as an essay. For example, authors Strauss and Howe proposed that American history follows a generational cycle, providing explicit dates for the cycle. They also described how they arrived at these dates. Given this information, multiple scholars, looking at the same historical data and using the same qualitative generational methods should find the same cycle dates. I demonstrated this was not the case twenty years ago when I was a member of the now-defunct Fourth Turning generational cycle discussion forum. I compared proposed generational cycles for the Roman Empire from two posters (one a professional historian) plus my own contribution and found all three to be different. Two had similar turning points but were 180 degrees out of phase while the third was completely different with a different average cycle length. It seemed to me that different people employing the analytical methodology to the same period of history and getting wildly different results was like administrating a two blood alcohol tests with one saying the subject was plastered and the other that he was stone cold sober. In such a case, the analytical methodology is obviously worthless.
Another example of different takes on the same evidence is the different dates provided for the Kondratieff cycle after the 1920 peak. This cycle was first characterized by ND Kondratieff in the 1920’s who noted that plots of price indices from a number of Western countries showed co-incident fifty-year cycles. For the US cycle the peaks were in 1814, 1864 and 1920 and the troughs were around 1790, early 1840’s, and mid-1890’s. Everyone agrees on these. In the early 1930’s the world goes off the gold standard and prices start trending up (and still are trending up). Cycles are no longer directly visible in the price plot. At the same time, interest rate (which in the past had tracked the price cycles) continued to show a cycle with a trough in 1946 and a peak in 1981. The stock market also showed cycles that corresponded to Kondratieff cycles, and these continued to happen, suggesting a trough in the late 1940’s and a peak around 1980. Based on things like this many cycle scholars believed the Kondratieff phenomenon was still happening, it was just obscured by the secular inflation resulting from abandoning the classic gold standard in 1933. But the estimated turning point dates were all over the map: 1940 to 1954 for the trough, 1970-1981 for the peak, and 1990-2021 for the next trough (if it has even come yet).
I developed a tool for detrending the price series which produced a result showing the same clear-cut cycles Kondratieff used to identify the cycle in the first place. This method gave a clear-cut trough in 1946 and peak in 1981, exactly in line with interest rates, consistent with the stock market cycles, and within the range of the other workers’ assessments. Based on the stock market cycle alignment with the Kondratieff cycle I expected a “fall from plateau” event to happen sometime after the stock market peak in 2000, which would serve as a test of whether or not the Kondratieff cycle was still in operation. It did finally happen in 2008 and was even accompanied by a financial crisis (as the previous three such events in 1819, 1873 and 1929 had been). It looks very much like the other three in the chart. Anyone starting with the same price series and performing the same operations will get the same result as I did, while the inspection method leads to different results from different scholars.
Use of time series to choose between alternate plausible accounts
This excursion into cycles illustrates my approach to how to look at social issues. When possible, I try to get the data to speak for themselves, which sometimes requires transformations of the data to reveal hidden dynamics as I did with the reduced-price tool. Sometimes a data series is matched to another one to which it should be plausibly related and the two consulted to tell a story.
Example 1: Relative immiseration of the unskilled working class in the late 19th century
Figure 1 shows three trends. One is a trend in unskilled wages that have been adjusted for both inflation and economic growth using the per capita GDP. This measure tracks how well people in this income category keep up with rising living standards. Or how their status relative to the rest of the population changes over time. When it is falling working people will increasingly feel they are falling behind.1 They may become discontented with their situation, eventually acting out in some way. An example of acting out might be the second trend examined in Figure 1: the number of strikes per year (in hundreds).
There seems to be no clear-cut correlation between strike frequency and wage levels: there was a strike wave in the 1890’s that had no discernable impact on wage trend, while a second wave in the late teens was associated with a rising wage trend. Labor market conditions provide a better explanation for these observations, however. The 1890’s was a time of depression (low demand for labor) and high unemployment (labor surplus). A low price for labor is to be expected under these conditions. In contrast, the late teens were during WW I, when the economy was booming (strong demand for labor) and many workers were off at war producing a labor shortage—implying a rising price for labor. This suggests that strikes (at least at this time) were more a measure of worker distress and anger than an effective way to redress their grievances.
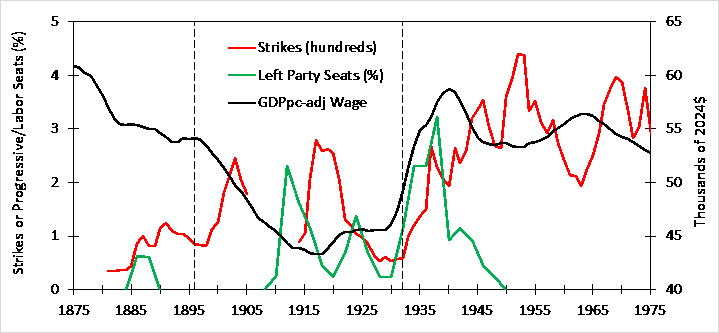
Figure 1. Unskilled wage adjusted to 2024$ with GDPpc, strikes, and % of House held by minor left parties
A third trend is the fraction of House seats held by various labor-left parties and the Progressive Party. This can be seen as a measure of worker efforts to address their falling status, as another expression of working feelings, or both. The vertical dashed lines in the figure show critical elections that establish dispensations (political orders favorable to the party which establishes them). One of these critical elections was in 1896, after which Presidents McKinley and T. Roosevelt established a Republican dispensation. Another was in 1932, after which President F. Roosevelt established a Democratic dispensation. Based on Figure 1, it does not look like the 1896 critical election had any impact on the wage trends. In contrast, the 1932 critical election was associated with a rapidly rising strike frequency and rising wage trend. The 1930’s were a time of economic depression and surplus labor even worse than the 1890’s; rising wages should not have happened—yet they did. Roosevelt’s New Deal program contained features explicitly designed to boost wages and promote unions which delivered, as I describe here. I believe this wage-boosting policy is what forged the New Deal-working class coalition that was the political backbone supporting the Roosevelt dispensation. It is unlikely that third parties played much of role (other than as a source of ideas) in changing the economic status of working-class Americans in decades after 1932, which is borne out by the disappearance of third parties by the end of the forties, with no adverse effect on the wage trend.
Example 2: The gold standard and farmers
Figure 2 shows agricultural prices (average of corn, wheat, and cotton prices) over the 1865-1910 period. This series shows how the dollar value of the goods farmers produced was cut in half in the thirty years after the civil war, while the dollar value of their debts did not decline. Farming was a low margin business then as now, which meant farmers dealing with a declining value of their product relative to fixed debt were in a precarious position. One bad season could lead to bankruptcy and loss of their land through foreclosure.
The cause of declining prices was the gold standard. Over 1862-65 paper money (greenbacks) had been issued to help finance the war, This was fiat money, not backed by gold or silver, but by the full faith and credit of the US government. Use of greenbacks to fund wartime deficits resulted in inflation (agricultural prices doubled from 1860 to 1865). After the war the government sought to bring the price level down so as to bring the dollar closer to its prewar value in terms of gold. In 1875 greenbacks and gold became convertible because the value of the dollar had been sufficiently deflated by the government to make this possible. Deflation associated with maintaining the dollar-gold exchange value2 continued until by the mid-1890’s the general price level had returned to prewar levels. Farmers blamed gold standard monetary policy for their economic troubles.
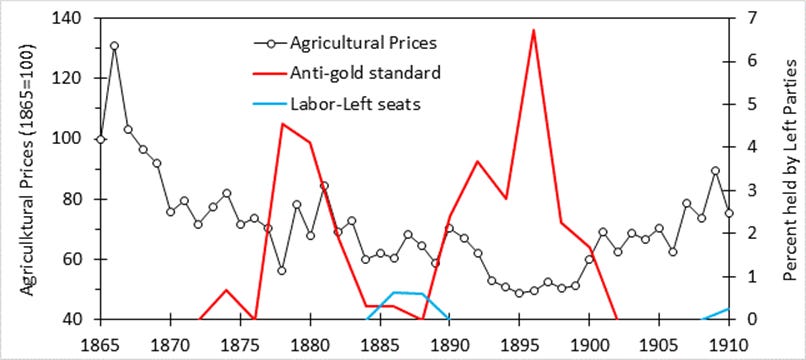
Figure 2. Agricultural prices (geometric mean of corn, wheat & cotton prices changes) and political representation
From the farmer’s point of view, the reason for the deflation was the desire of bankers, investors and other “money men” to see the value of their money rise with time. Since the rich run the country, they decided it was better that the value of what farmers produce degrade with time due to deflation than for rich people’s money to degrade due to inflation. Farmers had been very happy with the war-time Greenback system (which had boosted the value of their output) and were not happy to see it go. The reestablishment of the gold standard in 1875 saw the rise of the “Greenback Party” that pushed a more inflationary monetary policy. Rural political activists saw farmers as inveterate opponents of bankers and the gold standard they worshipped. In this they were an echo of Andrew Jackson’s “Bank War” two generations earlier. Jackson is described as a populist, and these farmers also saw themselves as representatives of the common (white) man. In the 1890’s a Populist Party arose, calling for an inflationary “free silver” program to provide relief to debt-stricken farmers. Figure 2 shows that prices had reached new lows then and farmers were really hurting, which led to significant electoral gains for the Populists in the early 1890’s elections.
A direct analogy can be made between the price trend in Figure 2 and the wage trend in Figure 1. Both represent discontent with an elite-made status quo. The strike and minor party activity in Figure 1 has its counterpart in anti-gold politics represented by the red line in Figure 2, which is a measure is the fraction of the House of Representatives held by parties opposing the gold-standard. It contains seats held by the Greenback, Populists, and various silver parties. Also shown is the left-leaning seat share from Figure 1, which shows the dominant minor party concern was (white) farmers’ plight and not urban (immigrant) workers. Note that the price level bottomed in 1895, rising some 50% afterward. As the price level rose coming out of the 1890’s depression lows, the anti-gold third parties disappeared and did not return. The farmers’ deflationary dilemma was solved.
Analysis of example 2: Contrasting two views
This timing suggests that the 1896 critical election might have brought the solution to their problem. Indeed, the 1896 election featured the Democrat William Jennings Bryan running on an anti-gold message. The data suggest that he must have won and implemented his inflationary program, like Franklin Roosevelt did with his wage-growth program. But he lost the election, and went on to lose two more. Frank J. DiStefano argues that though Bryan lost. His rebellion won:
Not long after Bryan’s campaign, a new Republican president, Teddy Roosevelt, saw the discontent that fueled it and adopted the ideas of an alternative movement also seeking to address that discontent in a different way. This Progressive Movement advanced its own reforms to address the corruption and disruption of industrialization—an 8-hour work day, antitrust controls on national corporations, abolishing child labor, creating public schools and parks, embracing efficiency, breaking up political machines, and the direct election of senators, among many more. This movement would come to dominate the entirety of American politics and government. Bryan lost, but his rebellion won.
Things like the 8-hour day, antitrust, abolishing child labor, and creating public schools and parks address the problems for urban workers (who are employees) and urban consumers. That is. the sort of problems represented by the wage trend in Figure 1. These are not the problems farmers (who are business owners) needed to be fixed. Farmers were exempt from child labor laws and overtime laws when they were originally passed and had no use for parks. DiStefano gives little attention to the farmers deflation problem, which was resolved by the discovery of new sources of gold in Alaka in 1898 and not anything Bryan did. Rising supply of gold increases the money supply leading to higher prices, which appeared by end of the decade. Bryan was easily defeated in 1900 because his core issue no longer had traction. The Progressive movement to which DiStefano refers dealt more with problems for the urban working class (to whom Figure 1 applies). Their problems were not addressed by the progressive programs of Republicans Roosevelt and Taft as shown by the continuation of the declining wage trend in Figure 1. They were not solved until the New Deal as described earlier. Additional evidence of Bryan’s lack of impact is that when a Democratic president was finally elected in 1912, it was a university president and a gold supporter, not a populist.
Description of my analytical method
The idea illustrated by these examples is an iterative use of descriptive history and data plots to develop a feel for what was going on at a time. First, I read an account that provides some idea of the things going on and an author’s take on it. This provides information on issues to be considered. I then gather information, plot it out, and see what sort of story it tells. This is why my Substack posts are so full of graphs. They do a lot of the heavy lifting for the message I wish to deliver. I look at other accounts to find one where the author’s take involves a story like the one the data seems to tell. I need confirmation than other scholars have seen these patterns and that I am not imagining patterns that don’t exist. This further reading often reveals more things that I should see if I can plot. If I read enough and look at enough data I can sometimes find out why different authors have different takes and begin to get a grasp in the thing being examined.
For example, I disagree with DiStefano’s take. Why? He is looking at the same piece of history and notes all the things that happened that I am aware of (we have equal knowledge). But he sees Bryan’s populism as a key feature in the progressive program going forward, while I do not. I suspect our differences come from the perspectives we have from our political affiliations (he’s a Republican and I’m a Democrat). As a Democrat, I am more sensitive to political differences on the left, while he would be more sensitive to differences on the right. For someone on the right, populists, labor-left, progressives and Democrats will seem to be more similar than they appear to someone on the left. Being in the other side, I see sharp differences between them. On the other hand, I would tend to see MAGA, libertarians, race realists, and movement conservatives as different flavors of conservative, while a conservative might see them as altogether different species.
These two examples are completed stories of problems, responses, and resolution. We know what eventually happened. The problem is much harder when examining a particular episode of history that is not yet complete. In part two I analyze the forces leading to working class men of different races and ages coming to embrace MAGA using a similar approach as used here.
Continue to Part II
I believe the falling trend in this measure since the seventies is a source of working-class discontent that has powered the MAGA movement, which will be explored in part II.
If growth in output proceeds at a faster rate than new gold can be produced, the result will be deflation.